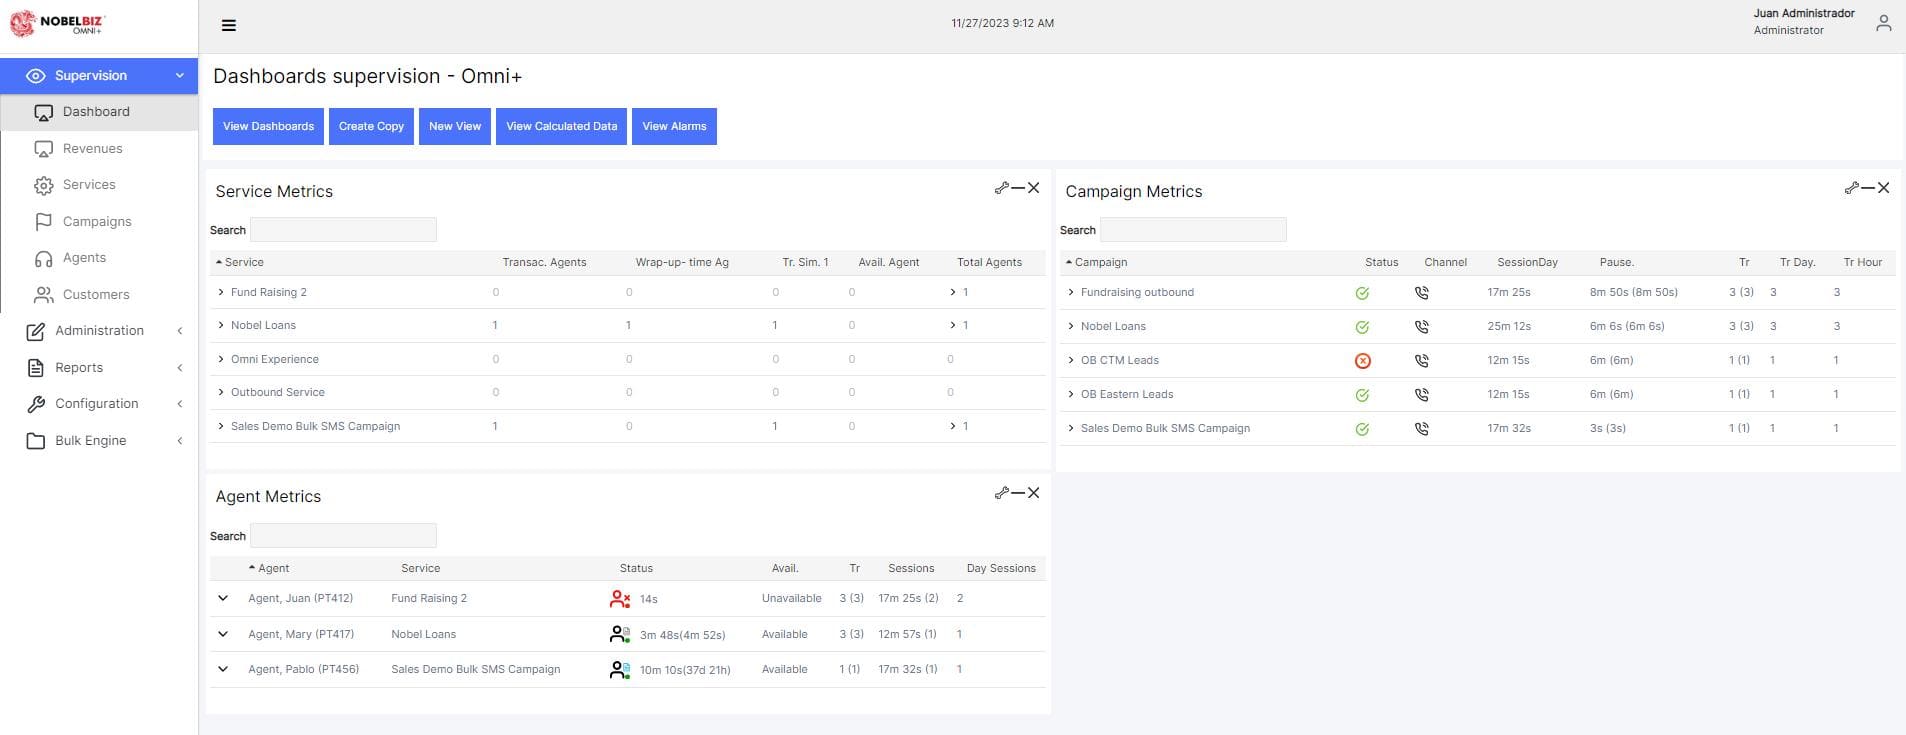
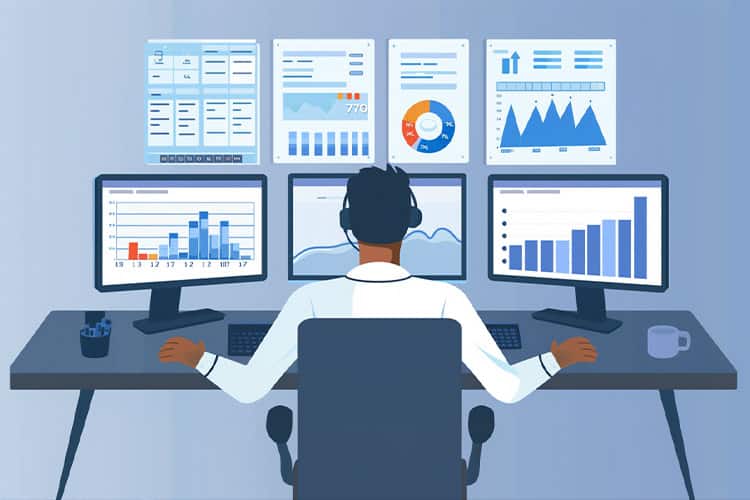
Call center dashboards play a vital role in contact centers. Call center dashboards provide the kinds of insights and metrics that contribute to having improved agent performance and more successful campaigns. These digital command centers offer a comprehensive overview of operations, enabling supervisors to make informed decisions in real-time.
Let’s delve deeper and explore the dashboard functionalities, key metrics, best practices, and their pivotal role in enhancing customer satisfaction.
What is a Call Center Dashboard?
A call center dashboard is a centralized tool designed to monitor and analyze various aspects of call center operations.
From call volume and trends to agent performance, customer satisfaction, and operational efficiency, these dashboards provide a holistic view of the contact center ecosystem. Supervisors rely on these insights to optimize processes and drive performance improvements.
Types of Call Center Dashboards
So what types of call center dashboards are there?
Real-time Dashboards: The Pulse of Operations
Real-time dashboards serve as the nerve center of contact center operations, providing instantaneous insights into ongoing activities. These dashboards enable supervisors to monitor queue activity, track topic trends, and assess agent skills in real-time.
With leading solutions, users can define alerts based on queue dynamics, user performance, conversation patterns, and agent presence. Multi-conditional alerts further enhance the capability to identify and address complex scenarios promptly, ensuring agility and responsiveness in managing customer interactions.
Historical Dashboards: Preserving the Journey
Historical dashboards act as time capsules, preserving the rich context of the customer journey across time. By generating comprehensive reports, these dashboards empower organizations to track and analyze historical data points such as service levels, call times, resolution rates, and customer satisfaction scores.
Insights gleaned from historical trends enable strategic planning, performance evaluation, and identification of areas for improvement. Historical dashboards serve as invaluable tools for benchmarking performance over time and driving continuous enhancement of service quality.
Agent Performance Dashboards: Empowering Frontline Excellence
Agent performance dashboards serve as compasses guiding frontline teams towards operational excellence. Integrated with real-time data feeds and up-to-the-second analytics, these dashboards offer supervisors a holistic view of agent performance across multiple teams and channels. Customizable features enable alignment with unique business needs, empowering supervisors to respond swiftly to changing dynamics. By monitoring key performance metrics such as efficiency, effectiveness, and adherence to protocols, agent performance dashboards facilitate targeted coaching, training, and resource allocation decisions, ultimately elevating the quality of customer interactions.
Choosing the Right Dashboard for Your Organization
Selecting the appropriate dashboard type depends on your company objectives, operational priorities, and desired outcomes.
Real-time dashboards excel in environments where agility and responsiveness are of utmost importance. They provide immediate insights for proactive decision-making.
Historical dashboards offer valuable context and insights for strategic planning and long-term performance evaluation.
Agent performance dashboards bridge the gap between real-time operations and historical trends, empowering frontline teams with actionable insights to deliver exceptional customer experiences.

Brad Dashnaw
”Their software is easy to use, easy to implement, and able to be integrated with our own platforms. We were able to train people easily, and deploy it to their computers in their home offices to keep productivity going!”
8 Key Metrics that every call center dashboard should have
1. Average Time to Answer: The time it takes for calls to be answered directly impacts customer satisfaction and service levels.
2. Call Volume: Monitoring fluctuations in call volume helps in resource allocation and capacity planning.
3. Missed Calls: Tracking missed calls enables proactive measures to minimize customer frustration and loss of potential business.
4. Abandoned Calls: Identifying trends in abandoned calls allows for adjustments in staffing and workflow to reduce abandonment rates.
5. Average Handle Time: Efficiency in resolving customer inquiries is reflected in the average handle time metric.
6. Keyword or Topic Occurrences: Analyzing keyword or topic occurrences aids in understanding customer needs and preferences.
7. Service Levels: Maintaining service level agreements ensures timely response and resolution for customer queries.
8. CSAT Score: Customer satisfaction metrics provide valuable feedback for performance evaluation and improvement.

- NobelBiz Call Log Analytics – Supervisor Dashboard
RELATED ARTICLE
The Power of Real-Time Monitoring in Call Centers
Best Practices in Dashboard Development
Creating effective performance dashboards demands a strategic approach that caters to the unique needs of users and organizations alike. Let’s explore key practices that ensure the development of impactful dashboards.
Strategic Planning
Just as every successful venture begins with a well-thought-out plan, dashboard development requires careful consideration of objectives and audience. Whether it’s orchestrating a space mission or organizing a celebration, meticulous planning sets the stage for success. Define your target audience, understand their expertise level, and identify the specific data points essential to their roles.
Audience-Centric Design
Tailoring dashboards to cater to the diverse needs of users is crucial. Recognize that managers seek different insights compared to frontline agents. Ask important questions:
- Who are the end-users of this dashboard?
- What level of expertise do they possess?
- Which data is critical for their decision-making processes?
- Centering dashboard design around user roles ensures relevance and usability.
Relevant Data Selection
Effective performance dashboards refine complex datasets into actionable insights. However, cluttering dashboards with irrelevant data only gets in the way of proper usability. Prioritize data relevance by asking:
- How does this data contribute to the dashboard’s objectives?
- Is this data essential for decision-making?
- Organize data logically and start with a minimalist approach, gradually adding complexity as needed.
Harnessing Filters Wisely
Filters are invaluable tools for accessing relevant data promptly. However, excessive filtering can lead to performance issues and user frustration. Mitigate this by structuring data presentation thoughtfully, reducing the need for excessive filtering.
Design with User Experience in Mind
Thoughtful design is the foundation of user-friendly dashboards. Employ principles that prioritize ease of use and accessibility:
- Leverage insights from eye-tracking studies to guide layout decisions.
- Utilize visual elements such as charts and color to enhance data comprehension.
- Select appropriate visual representations for different data types.
Continuous Improvement through Testing
Recognize that dashboard development is an iterative process. Solicit feedback from users and remain open to adjustments that enhance usability and effectiveness. Ensure the dashboard remains flexible and responsive to evolving needs by embracing a culture of continuous improvement.
Utilizing Call Center Dashboards: Real-world Examples
 Example 1: An Overwhelmed Call Center:
During peak hours, a call center experiences a surge in call volume, resulting in increased wait times and customer dissatisfaction. By monitoring call volume trends in real-time and reallocating resources accordingly, supervisors can mitigate the impact of spikes in demand and maintain service levels.
Example 2: Slow QA: Identifying blockages in the quality assurance process through dashboard analytics prompts proactive measures such as agent training or process optimization, leading to improved efficiency and performance.
Other Crucial Features in Call Center Dashboard Software
- Omnichannel Communications: Seamless integration with multiple communication channels ensures a consistent customer experience.
- Real-time Transcriptions: Transcribing calls in real-time provides valuable data for analysis and training purposes.
- Real-time Sentiment Analysis: Monitoring customer sentiment enables proactive intervention to address issues and enhance satisfaction.
- Integrations with Other Software: Integration with existing tools and systems streamlines workflows and enhances productivity.
- Strong Compliance Standards: Ensuring adherence to regulatory requirements safeguards against legal risks and reputational damage.
Call center dashboards serve as essential tools for optimizing performance, enhancing efficiency, and elevating customer satisfaction. By leveraging real-time insights and key metrics across call volume, agent performance, customer satisfaction, and operational efficiency, organizations can navigate challenges, capitalize on opportunities. Call center dashboards ultimately help companies deliver exceptional service experiences for their customers.

Michael McGuire is a contact center industry expert with almost two decades of experience in the space. His experience includes roles as Director of Contact Center Digital Transformation at NobelBiz, and as Director of Operations at FLS Connect, managing multiple call centers. As President of Anomaly Squared and Targeted Metrics, Michael successfully transitioned companies into remote operations and significantly boosted revenues. With a strong background in customer service, leadership, strategic planning, and operations management, Michael excels in driving growth and innovation in the call center space.
Mike is also a proud Board Member for R.E.A.C.H Trade Group, promoting consumer protection and satisfaction and Co-host of the Off Skripted Podcast – a show about Life, Call Centers and everything in between.


